
The Definitive Guide to Data-Driven ICPs
How to build, optimize, and operationalize ideal customer profiles (ICPs) that fuel predictable and accelerated revenue growth rates.
The Trillion-Dollar ICP Problem
Every SaaS company thinks it knows its Ideal Customer Profile (ICP). The truth? Most ICPs are guesswork dressed up as strategy. New Narrative: ICP segments are the new go-to-market (GTM) revenue infrastructure - the foundation drives the entire GTM strategy.
Here's the brutal reality: A B2B SaaS company at $50M ARR typically spends $15–20M annually on sales and marketing. Yet two-thirds of those "qualified" leads will never convert to pipeline, and nearly 80% will never convert to revenue. Multiply this waste by the 100,000+ B2B Saas companies, and we have a trillion-dollar ICP problem.
At AlignICP, we believe ICPs shouldn't just describe who might buy—they should predict who will buy, expand, and renew to maximize customer lifetime value (LTV). That requires moving beyond using simple ICP attributes, such as win rates and intuition, to discover ICPs toward a data-driven system that unites marketing, sales, and customer success around a shared data-driven definition of "ideal." That's a holistic bow-tie funnel-minded approach to powering your GTM strategy and execution.
This framework for your ideal customer profiles (ICPs) is intended to provide a step-by-step explanation of how to discover and operationalize ICPs that maximize company growth rates. It's not about adding more data to dashboards; it's about turning insight into action and creating ICPs that unify go-to-market execution around accounts that deliver the most value.
Who should read this ideal customer profile (ICP) guide?
- CMOs and CROs ready to replace intuition with precision
- CEOs and CFOs who are looking to create more efficient growth and predictable revenue
- RevOps leaders tasked with building scalable GTM systems
- Marketing teams fighting lead quality challenges
- Sales leaders aiming to shorten cycles and win more deals
- Growth-stage SaaS companies ($5M+ ARR) looking for predictable scale
Chapter 1: Why Traditional ICP Development Is Failing
The Reality Check
We surveyed 15 GTM leaders at a $70 million B2B SaaS company with approximately 400 customers. We asked product management, marketing, sales, and customer success to identify their best-performing industry vertical over the last 12 months.
The results surprised us; each team clustered their answers within specific industry verticals. Here’s what emerged:
- Sales & Marketing Selection: Entertainment, Travel
- Customer Success & Product Management Selection: Retail
As we compared the survey results against our analysis, we observed that each team responded correctly based on the KPIs that drove their compensation. Sales and marketing selected the verticals that were the easiest to acquire, while CS and Product Management selected the accounts with the strongest retention and highest NPS.
- Sales & Marketing: They were correct, the Entertainment & Travel verticals had the highest win rates, and the greatest average sales price (ASP) over the last twelve months. However, these customers had historically experienced high rates of churn and limited expansion.
- Customer Success & Product Management: They were correct, these customers had the best retention rates and provided the highest net promoter scores (NPS).
Although the GTM team didn’t share the same perspectives on the best-performing customer verticals, each team correctly identified the customer verticals that were performing the best for their respective part of the business.
What if the prospects who are easy to acquire are different from the ones who renew and expand?
We typically see less than 20% of open pipeline fall within the high-value ICP prospect segments we identify. We usually see less than 30% of the active customer base share these same attributes (high win rates, low churn).
Having worked with a broad set of customers ranging from those with $ 12 million in annual recurring revenue (ARR) to those with over $400 million, we find it relatively uncommon when customer segments are both easy to acquire and have a high propensity to expand and renew.
When the above is true, we find ourselves with companies that have suboptimal growth rates and high customer acquisition costs (CAC) with poor LTV/CAC ratios. As revenue leaders, we struggle to hit our numbers and find it challenging to create a predictable revenue engine that drives our company valuation.
The Hidden Costs
Poor ICPs erode and compromise every part of GTM execution:
- Marketing: Higher CAC, weaker ROI, campaigns that don't resonate.
- Sales: Longer cycles, lower win rates, bloated headcount to hit numbers.
- Customer Success: Churn, low expansion, rising support burden.
- Product Management: We find ourselves forced to build one-off features to retain customers, vs. building the best product to win a market.
When acquisition and long-term fit diverge, even the most well-funded companies stall. Revenue growth slows. Churn rises. Product teams chase edge cases. And leadership is forced to make decisions in the dark.
The cost isn’t just operational. It’s existential.
This guide has shown you how to shift from gut feel to grounded strategy and from opinion to objective signals that tie to long-term value. Now the question is: will your ICP be the limiting factor to growth… or the foundation of it?
The Path Forward - Call To Action
We need to evolve our current approach by introducing new frameworks for thinking about ICP segmentation and customer value realization. Happy customers that renew, expand, and drive inbound pipeline are the foundation for creating efficient growth. Yet today, most revenue leaders have a limited or no understanding of which customer segments are responsible for driving efficient growth and, therefore, the company's valuation.
Done right, companies who unlock their customer data to discover their ICP segments see:
- 30–50% lift in marketing conversion rates
- 20–35% shorter sales cycles
- 15–25% higher customer lifetime value
And most importantly: an improved GTM revenue engine where marketing, sales, and CS are working from the same playbook.
Chapter 2: Introducing Two New Frameworks
The good news here is that we've pioneered a new framework that redefines how ICPs are built—by grouping sales and marketing's leading indicators into Message-Market Fit (MMF) and aligning them with the key business efficiency metrics that quantify Product-Market Fit (PMF).
Terminology & Definitions
- Message-Market Fit (MMF): Leading indicators of how effectively your message converts buyers into customers. This includes sales metrics such as win rate, sales velocity (measured in days-to-close), LTV/CAC ratios, and average sales price to help quantify MMF.
- Product-Market Fit (PMF): Lagging indicators of how well your product delivers durable, expanding value. Business efficiency metrics such as customer lifetime value, net revenue retention rate (NRR), gross revenue retention (GRR), NPS, and others, are used to quantify PMF.
- See our blog post, Net Revenue Retention: Your Complete Guide, to unpack metrics and why they matter.
Core MMF Metrics
- Win Rate: % of opps closed. Shows ICP segments where messaging resonates.
- Average Selling Price (ASP): Identifies ICP segments delivering the largest deals.
- Lead-to-Opp Conversion: Validates whether early messaging attracts the right buyers.
- Pipeline Coverage: How much pipeline is required to hit targets?
- Sales Velocity: Shows how quickly an ICP segment converts and where to focus first.
Core PMF Metrics
- Lifetime Value (LTV): The durability and amount of revenue an account delivers over time.
- Net Revenue Retention (NRR): Expansion strength of an account and segment; 110%+ is best-in-class.
- Gross Revenue Retention (GRR): Baseline stickiness of an account and segment; 90%+ indicates healthy segments.
- Use Case Expansion: Depth and breadth of adoption and the long-term value that it delivers within accounts and segments.
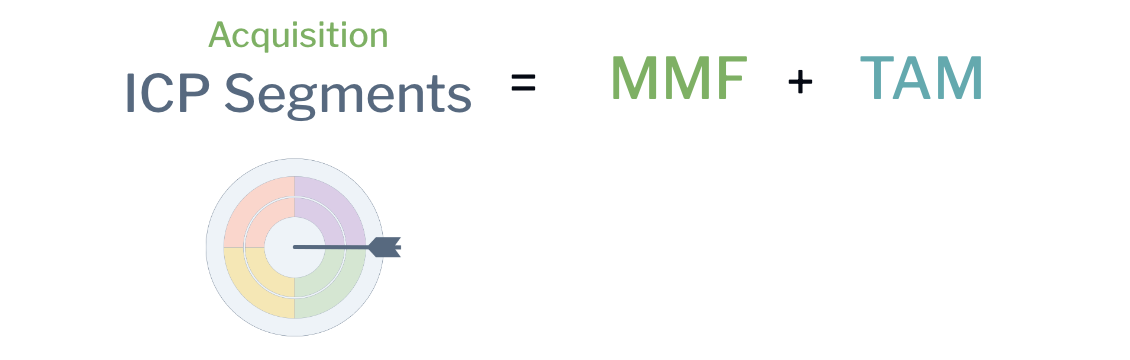
Start with Message-Market Fit (MMF)
The best ICP strategies start simple: alignment beats complexity. Instead of diving into building out account- and segment-level revenue models , smart GTM leaders focus first on Message-Market Fit (MMF) metrics and market opportunity sizing (TAM/SAM).
This MMF-first approach answers one key question: “Where can we win today with what we have?” By looking at win rates, sales velocity, ASP, and conversion rates—and layering in TAM/SAM—you quickly see which segments respond to your message and where meaningful opportunity exists.
The payoff is immediate clarity. Sales knows which accounts to prioritize. Marketing focuses campaigns where message resonance is proven. RevOps models pipeline coverage with confidence. Alignment replaces debate, and quick wins build momentum.
The Ideal Strategic Lifetime Value ICP Approach
Once MMF-driven priorities are clear, the next step is layering in Product-Market Fit (PMF) metrics like NRR, GRR, LTV, and use case expansion. This shifts the focus from winning customers now to building efficient and predictable revenue growth over time.
By combining MMF and PMF insights with market penetration and opportunity sizing (TAM/SAM), you get a complete, data-driven view of where to focus. The formula:
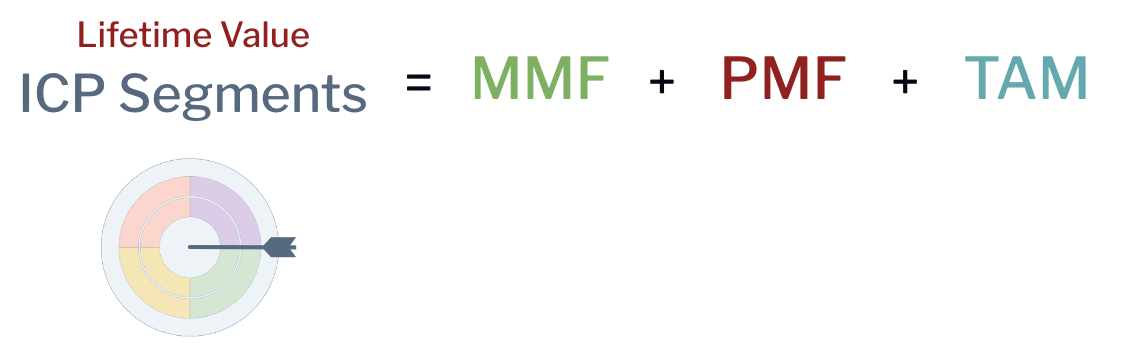
The payoff isn't just sharper ICPs—it's smarter GTM execution that yields a much greater return. Marketing can target the highest-converting audiences. Sales can prioritize accounts that will not only close quickly but also grow in value. Revenue operations can run accurate pipeline gap analyses to enhance forecasting accuracy. Executives can confidently direct people, programs, and budget toward the segments that will yield the greatest return.
The MMF - PMF Matrix
Plotting customer segments across MMF and PMF reveals the truth about your growth levers and where to focus your GTM energies:
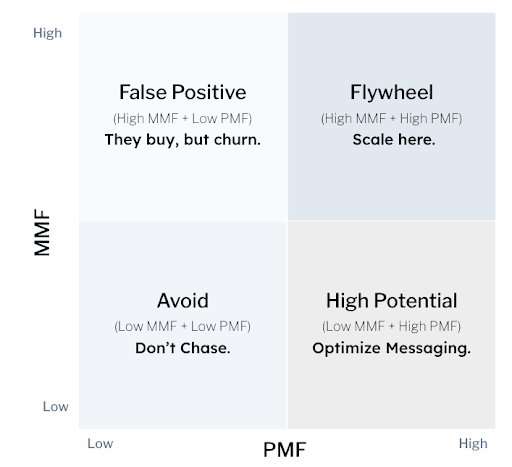
Why it Matters?
- Early sales momentum can mask retention risks—creating unpredictable revenue.
- Messaging problems often masquerade as product problems—leading to misguided fixes.
- Without this separation, companies double down on the wrong bets—burning time, money, brand equity, and talent.
The outcome: This framework gives leadership the clarity to align GTM teams, sharpen focus, and invest deliberately—so every dollar, every rep, and every campaign pushes you closer to (and often beyond) your marketing and pipeline targets.
Chapter 3: Intent
Prioritize your Target Account List with Intent Data
Even the most carefully defined ICP segments represent a static picture of who your best customers are. But markets don't stand still, and neither should your ICPs. By layering in intent data from platforms like 6sense, Demandbase, or Intentsify, you transform ICPs from static definitions into dynamic, in-market targets.
Why Intent Matters?
ICP attributes tell you who is a good fit. Intent data tells you when that account is actively researching solutions and what topics they care about. This context allows marketing and sales to move from "broad ICP targeting" to timely, precise engagement.
Core Components of Intent Data
- Intent Stages: Accounts are scored across stages (e.g., Awareness, Consideration, Decision) based on research activity and content consumption. This helps GTM teams prioritize outreach to accounts that are further along the buying journey.
- Keyword Topics: Intent platforms track surges in topic-level research (e.g., "pipeline forecasting," "sales velocity," "customer retention"), giving you visibility into pain points and buying triggers at the account level.
- Signal Strength & Frequency: Monitoring the volume and recency of intent signals helps distinguish between casual research and serious buying behavior.
- Overlay on ICP Segments: Enrich CRM accounts that fall into your ICP definition with real-time intent signals. This helps you see not just who is ICP-fit, but which ICP-fit accounts are in-market now.
How to Integrate Intent into ICPs
- Prioritize by Stage: Align campaigns, cadences, and outreach strategies to intent stages—e.g., thought leadership for "Awareness," demos for "Decision."
- Refine Messaging by Topic: Use keyword topic insights to personalize messaging to the exact pain points accounts are researching.
- Feedback Loop: Feed intent data back into your CRM alongside ICP attributes, so scoring, routing, and reporting reflect both fit and readiness.
The Payoff
By combining trusted ICP definitions with account mapping and expansion, you create a closed loop from analysis to execution. Your GTM teams now know not only who to target and why, but also exactly which accounts to focus on today—and where to look for tomorrow's growth.
Chapter 4: The Data-Driven ICP Framework
From Intuition to Intelligence
Most ICPs are born in brainstorming sessions and die in guesswork. The data-driven approach flips the script: start with rigorous analysis, and end with ICP segments that are validated, quantifiable, and directly tied to business outcomes. Discover the meaningful, targetable attributes that define your best customers, understand why those segments matter most, and layer in intent signals to focus GTM execution where it will have the most impact and maximize the chances of meeting/exceeding your growth targets.
Messy CRM, Clear Path Forward
We know most CRMs are messy. Data is scattered, incomplete, and often feels more like a liability than an asset. You're not alone—every team we talk to wrestles with the same frustration: "How can we make smart decisions if we can't even trust the data we have?"
That's precisely why our approach doesn't rely on fixing every corner of your CRM. Instead, we start with the most reliable and highest-quality data you already have—your bookings data. By surgically extracting and structuring the data tied to closed revenue, we cut through the noise and anchor your ICPs in a foundation that's both trustworthy and meaningful. This gives you confidence that the insights we generate are rooted in truth, not guesswork—while opening the door to clean data.
Step 1: Collect and Prepare Data
Compile your essential MMF and PMF metrics data. Start by gathering the narrow set of sales metrics that measure Message-Market Fit alongside the booking insights that generate your Product-Market Fit business efficiency metrics (see recommended list below). Meet with your Salesforce admin to verify you haven't missed any critical data points. Then collaborate with them to extract this essential data into your preferred BI tool—whether Power BI, Tableau, Excel, or Google Sheets.
Step 2: Define Key Attributes and Account Insights
Most ICP definitions stop at firmographics — industry, size, geo. That’s a mistake. To truly segment for growth, you need to dig deeper: which accounts expand, which retain, which buy fastest, and why. Step 2 breaks down the key attributes and account insights every marketer should capture to ground ICP discovery in business impact, not vanity data.
- Booking Data: From our experience, the CRM is the source of truth for your booking data. Extracting key fields—contract value, renewal dates, upsells, churn events—provides the foundation for calculating core revenue efficiency metrics like Lifetime Value (LTV), Net Revenue Retention (NRR), and Gross Revenue Retention (GRR). These metrics reveal not just who is buying, but which accounts and segments generate durable, compounding value over time. Anchoring ICP discovery in this revenue-backed data ensures you're segmenting around business impact, not vanity attributes.
- Firmographic: Demographics and firmographics tell you who a customer is, but they don't explain why they buy or how they create value with your product. Firmographic attributes like employee size, top-level and sub-industry, geo, sales stage, help you define your ICP with the targetable attributes that matter most related to ICP segment definitions.
- Technographic: if your solution requires or relates to a customer's tech stack, IT maturity, or compliance requirements, ensure you include technographics in your data export.
- Use Case: Use cases reveal why customers buy and how they get value—not just who they are. By adding a simple dropdown in your CRM for sales or CS to tag each customer and prospect account with its primary use case, you turn anecdotal knowledge into structured data. This creates a powerful lens for ICP discovery, helping you connect accounts to pain points, owners, and ROI drivers with precision.
Step 3: Data Audit: Normalization, Standardization, and Taxonomies
Review the data to identify any data enrichment gaps and determine if data normalization and enrichment updates are necessary to address these gaps. Ensure quality through hygiene, enrichment, and consistency. Bad data is the enemy of predictive ICPs. Note that an additional value of doing this work is to package your key go-to-market data for LLM readiness through market context protocols (MCP) servers.
Preparing Your CRM Data for ICP Analysis
The quality of your ICPs depends on the quality of your data. Before you analyze, take these steps to ensure your booking and attribute data is reliable and actionable:
- Audit for Completeness: Review CRM account and deal records to identify missing or inconsistent fields (e.g., industry, deal size, renewal dates).
- Normalize Data: Standardize entries—ensure that values like industries, regions, and stages follow a consistent taxonomy to prevent analysis fragmentation.
- Fill Gaps with Enrichment: Use third-party enrichment (e.g., Clearbit, ZoomInfo) to fill in missing firmographic or technographic attributes.
- Hygiene and Consistency: Deduplicate records, validate email and domain integrity, and align account hierarchies (parent vs. child accounts).
- Anchor on Bookings Data: Prioritize closed revenue data—contract values, churns, renewals—since it is typically the most reliable and essential for LTV, NRR, and GRR analysis.
- Package for Advanced Use: Once clean, structure your dataset so it's BI-ready (for Tableau, Power BI, or Sheets) and future-proof for AI use cases through Market Context Protocol (MCP) servers.
Why it matters: Think GIGO – garbage in, garbage out. Bad data is the enemy of predictive ICPs. Good data turns your CRM into a revenue intelligence engine.
Step 4: Analyze and Recognize Patterns to Discover Your ICP Segments
Once your CRM data has been audited and enriched, the next step is to analyze it in a way that uncovers patterns that morph into true ICP segments. This is where data science goes beyond surface-level reporting and begins to reveal why certain accounts consistently outperform others.
From Data to ICP Insights
- Unstructured → Structured: Transform unstructured data (notes fields, call transcripts, support tickets) into structured variables using natural language processing (NLP) or tagging frameworks. This surfaces qualitative drivers—pain points, decision criteria, ROI signals—that can be paired with quantitative metrics.
- Clustering (K-Means and Beyond): Use clustering algorithms like K-means to group accounts by firmographic, technographic, and behavioral similarities. These clusters often expose natural ICP patterns hidden in raw data.
- Decision Trees & Correlation Analysis: Apply decision tree models to identify which attributes most strongly predict high-value outcomes (e.g., LTV > $100k, NRR > 120%). Complement this with correlation analyses in R or Python to rank "must-have" vs. "nice-to-have" ICP attributes.
Step 5: Permutation Analysis: Finding the Signal in the Noise
After clustering and initial correlation analysis, the next step is permutation analysis—systematically testing combinations of MMF (Message-Market Fit) and PMF (Product-Market Fit) metrics against account attributes to discover which factors are most predictive of high-value ICP segments. For example, testing whether the combination of sales velocity, employee growth, and cloud adoption correlates more strongly with high NRR than any single attribute alone.
Because of the complexity and combinatorial explosion, you'll need to narrow your scope:
- Focus on a handful of MMF metrics (e.g., win rate, ASP, velocity) and core PMF metrics (e.g., NRR, LTV).
- Pair them against a shortlist of high-value attributes (e.g., industry sub-sector, employee size, key use case, tech maturity).
This disciplined narrowing ensures the analysis is tractable, statistically sound, and—most importantly—actionable.
Pro Tip: If you don't have in-house data science expertise, enlist a data-savvy analyst who can build regression or permutation models in R/Python, or leverage a platform like AlignICP that automates this analysis for GTM teams.
Step 6: Market Size & Prioritize
The next step is to layer on market penetration rates (what share of this segment you've already captured) and opportunity sizing through TAM/SAM (how much potential remains). Together, these steps provide a high-level yet powerful view: which ICP segments not only generate quick wins but also compound value, and how significant the addressable opportunity truly is. This allows marketers to confidently prioritize investments, campaigns, and resource allocation toward the segments where impact and upside are most significant.
Key Market Opportunity Metrics for ICP Segments
1. Segment Health Tracking:
- Why it matters: Track the employee growth rates (proxy for revenue) of an ICP segment and contrast the growth rate against individual accounts within that segment. This provides the marketing and sales teams with an understanding of the health of a specific ICP segment.
- How to use: Pull employee headcount data from enrichment tools (ZoomInfo, LinkedIn, Clearbit) and calculate YoY employee growth rates. Overlay this with your MMF/PMF scores to highlight segments with both strong conversion potential and healthy growth rates. Avoid segments that are contracting due to things like high interest rates.
2. # of Accounts in TAM/SAM:
- Why it matters: Shows the absolute number of companies that fit your ICP definition within the Total Addressable Market (TAM) and Serviceable Addressable Market (SAM).
- How to use: Start with TAM (total possible accounts fitting broad criteria), then narrow to SAM (accounts realistically targetable with your GTM model). For example: 10,000 TAM accounts in your ICP segment, of which 2,500 are SAM (reachable by your team/channels).
3. Dollar Value of TAM/SAM:
- Why it matters: Provides the revenue potential of your ICP segment. Multiply the number of accounts in TAM/SAM by the average deal size (ASP) or projected customer lifetime value (LTV).
- How to use: If ASP = $100k and SAM = 2,500 accounts, your SAM revenue opportunity is $250M.
4. Market Penetration (%):
- Why it matters: Shows how much of the segment you've already captured—and therefore how much whitespace remains.
- How to use: Divide your current number of customers in the ICP segment by the total SAM. If you've closed 125 accounts out of 2,500 SAM, penetration = 5%. Pair this with revenue penetration (current bookings from the segment ÷ SAM revenue potential).
These metrics, layered on top of MMF + PMF performance, give you both a qualitative lens (does this segment convert well and stick?) and a quantitative lens (how much growth headroom is left?).
Step 7: Review your ICP Segments with Additional TAM/SAM insights
Now that you've built ICP segments using MMF and PMF insights, validated them through clustering and permutation analysis, and size the market opportunity with TAM/SAM and penetration metrics, the next step is to bring it back to your business objectives: meeting and exceeding pipeline targets.
This is where the real magic of ICP analysis comes through: alignment. You're not only identifying who your ICP segments are and which have the strongest near-term market potential—you're also uncovering the why behind the who. That context turns ICPs from abstract personas into predictive, data-backed segments everyone can rally around.
Because the analysis is grounded in bookings and performance data, the numbers themselves become the source of truth. No longer are ICPs left to subjective interpretation or internal debate between marketing, sales, and customer success. Instead, the data unifies teams, creating a shared view of the customers who matter most, why they matter, and how to win more of them.
From here, you can stress-test ICPs against pipeline goals:
- Do these segments generate enough coverage (3–5x pipeline vs. target) to hit near-term bookings?
- Are resources and campaigns weighted toward the most efficient segments with the largest whitespace?
- Does your mix balance fast-closing opportunities with durable, expanding accounts?
The end result: ICPs move from a theoretical exercise into a living system of alignment—one that sharpens GTM focus, optimizes resource allocation, and unifies sales, marketing, and CS around a single definition of "ideal customer."
- Segmentation Scoring: Overlay MMF and PMF scores onto these clusters to rank segments by both sales momentum (leading indicators) and durable value (lagging indicators).
- Business Validation: Finally, validate analytical findings against business logic and competitive realities—for example, confirming that the most promising clusters also make sense in your go-to-market model.
Every ICP should have:
- Finite set of core attributes (usually less than 10)
- MMF/PMF scores
- TAM/SAM estimates
- GTM playbook including messaging, channels, and metrics
Step 8: Finalize ICP Segments and Create your Target Account List
With your ICP analysis complete, the next step is to operationalize the findings into a trusted, actionable set of ICP segments. This is where the cross-functional alignment pays off—because sales, marketing, and customer success all had a seat at the table, the finalized ICPs are not just statistically sound, but organizationally trusted.
From here, move to execution:
- Finalize ICP Definitions: Document the attributes, MMF/PMF performance metrics, and market sizing for each segment so GTM teams can clearly understand them.
- Map CRM Accounts: Identify the accounts already in your CRM that match the targetable attributes of each ICP segment. This creates immediate visibility into coverage, whitespace, and pipeline gaps.
- Look-Alike Accounts & Prospects: Use enrichment tools, data providers, or AI-driven look-alike modeling to find net-new accounts that mirror your best-performing ICP segments. These new accounts can be added to your CRM, giving sales and marketing a prioritized list of high-potential targets.
By combining trusted ICP definitions with account mapping and expansion, you create a closed loop from analysis to execution. Your GTM teams now know not only who to target and why, but also exactly which accounts to focus on today—and where to look for tomorrow's growth.
Audience Prioritization of GTM Targets - Account Segmentation Beyond ICP – Acceptable vs. Avoid
We want to empower revenue leaders to think like portfolio managers — strategically allocating resources to generate the most significant returns. High-value customer segments compound revenue over time, and your Ideal Customer Profile (ICP) reflects those most profitable customers — the ones where acquisition and retention consistently scale. But no company generates 100% of its revenue strictly from ICP segments. That’s why the next evolution of segmentation isn’t just about defining your ICP — it’s about understanding what lies beyond it and making calculated moves that maximize your GTM investments.
Rather than making binary decisions (ICP vs. non-ICP), leading SaaS GTM teams adopt a tiered segmentation model. The approach recognizes acceptable non-ICP segments that still yield profitable, scalable results, while also identifying those to deprioritize or avoid explicitly.
The 3-Tier Taxonomy of GTM Fit
Using historical Message-Market Fit (MMF) metrics (win rates, ASP, velocity) and Product-Market Fit performance metrics (LTV, NRR, CAC, churn rate, expansion potential), accounts can be segmented into four performance-informed categories:
1. Ideal – Strong Acquisition & Retention
These accounts demonstrate the highest synergy across the funnel—from top-of-funnel interest to post-sale growth. They:
- Convert at high win rates
- Expand reliably
- Retain long-term
- Fit both your MMF (Message-Market Fit) and PMF (Product-Market Fit) definitions
They are your Tier 1 focus: where marketing should deploy demand gen, where sales should prioritize outreach, and where customer success should look for case study potential. These accounts will yield the greatest return on your investment.
2. Acceptable – High Acquisition, Lower Retention
These accounts demonstrate the highest synerThese customers are easy to acquire and represent low-friction wins. However, they may:gy across the funnel—from top-of-funnel interest to post-sale growth. They:
- Churn earlier
- Show lower NRR or expansion opportunities
- Misalignment with long-term value metrics
Accounts in this tier can be highly productive for pipeline acceleration and short-term growth, particularly during aggressive GTM pushes. However, they require a retention-minded strategy and disciplined focus on keeping CAC low. To succeed, these accounts often need greater support from customer success and product teams. While they can deliver a positive ROI, they don’t warrant heavy field marketing spend or resource-intensive ABM motions.
3. Acceptable – Low Acquisition, High Retention
These are accounts that are harder to close, but once acquired, they thrive. You might see:
- Longer sales cycles
- Lower initial win rates
- Strong retention and expansion post-sale
Accounts in this tier demonstrate early signs of product–market fit (PMF) but lower than desired message-market fit (MMF) performance. They warrant sales execution adjustments and optimization to reduce friction. With the right sales enablement, channel strategy, or market education, these segments can evolve into “emerging ICPs.” They are highly profitable but may require added support to close — whether through sharper positioning, targeted enablement, or proving value in specific use cases or verticals. Focused investment here can unlock outsized returns as these accounts mature into core revenue drivers.
4. Avoid – Low Performance Across Lifecycle
These are accounts that are harder to close, but once acquired, they thrive. You might see:
- Longer sales cycles
- Lower initial win rates
- Strong retention and expansion post-sale
These customer segments will often cost more to acquire than they are worth to your business. They are your red flags—marketing should exclude them from targeting, and sales should deprioritize them entirely.
Actionable Takeaway: Build a Tiered Target Account List
Once you've segmented both your ICP and acceptable non-ICP groups, the next step is tiering your account list for execution. Here's how:
Tier 1 – ICP (Ideal Fit)
- Use AI enrichment or firmographic filters to identify net-new look-alikes
- Prioritize these for ABM campaigns, outbound sales sequences, and CSM playbooks
- Align messaging tightly to MMF/PMF insights
Tier 2 – Acceptable Accounts
- Use performance data to define clear entry thresholds (e.g., LTV/CAC ≥ 3:1)
- Adjust GTM playbooks by subtype: low-retention segments get tailored onboarding; high-friction segments get consultative sales support
- Test new channels or product packaging here before rolling upmarket
Tier 3 – Avoid ⛔️
- Suppress from outreach and paid media audiences
- Monitor for unintentional engagement and adjust targeting filters
- Use loss analysis data to reinforce the decision internally
Final Thought
Tiered account targeting is not about lowering your standards—it's about recognizing performance diversity across your customer base and making smarter investments. By codifying both your ICP and non-ICP acceptable segments, you give your GTM teams clarity, agility, and confidence. You'll also gain the ability to test new GTM strategies in acceptable zones without derailing your core ICP efforts—creating a balanced engine for predictable growth.
Step 9: Feed ICP Insights Back Into Your CRM
The final step in making ICPs actionable is ensuring the insights don't live in a BI dashboard or PowerPoint—they need to flow back into your CRM and GTM systems so they can actively improve how sales and marketing operate every day.
When considering what data to egress back into your CRM, focus on the minimum viable set of enriched, high-value attributes that will sharpen targeting, routing, scoring, and reporting:
- ICP Segment Tags: Assign each account to the ICP segment it belongs to, creating a unifying field sales and marketing can filter, prioritize, and report on.
- MMF & PMF Scores: Push back the weighted scores or classifications (e.g., High MMF / High PMF = "Flywheel") so teams can see both conversion likelihood and long-term value in context.
- Market Opportunity Signals: Include TAM/SAM penetration and whitespace indicators so reps understand the potential for capturing market share within a segment.
- Use Case Tags: Feed structured use case data back into the account record to enable campaign personalization and CS playbooks.
- Priority Scores or Tiers: Create a simple tiering system (Tier 1 / Tier 2 / Tier 3) that aligns to resourcing levels, so reps and marketers instantly know how much attention each account should receive.
By pushing these structured insights back into Salesforce, HubSpot, Marketo, Outreach, or Gainsight, you make the entire GTM tech stack smarter. Marketers can segment campaigns with precision, lead scoring models can weight ICP attributes, routing can match accounts to the right reps, and CS can tailor onboarding and expansion motions.
Bottom Line: ICPs aren't just an analytics exercise—they become the connective tissue that unifies your GTM systems, ensuring the same definition informs every campaign, rep, and customer interaction of "ideal."
Bonus Insight: Prioritize your Target Account List with Intent Data
Even the most carefully defined ICP segments represent a static picture of who your best customers are. But markets don't stand still, and neither should your ICPs. By layering in intent data from platforms like 6sense, Demandbase, or Intentsify, you transform ICPs from static definitions into dynamic, in-market targets.
Chapter 5: Operationalizing ICPs Across the GTM Motion
Once your ICPs are defined and validated, the real value comes from embedding them into the daily workflows of marketing, sales, and customer success. When ICP insights move from slide decks to system logic, GTM teams stop operating on guesswork and start executing in unison around a shared definition of "ideal."
Marketing
ICPs sharpen marketing from broad-based campaigns into precision-guided programs:
- Segment-Specific Messaging: Tailor value propositions and proof points to each ICP segment, addressing the pains and outcomes that matter most to them.
- Channel Optimization: Double down on the channels where each ICP segment converts best—whether that's paid search, industry webinars, or ABM display.
- MQL Calibration: Redefine lead scoring to focus on ICP fit rather than just activity. This ensures SDRs only touch leads aligned with your growth strategy.
- Content Strategy: Create case studies, ROI calculators, and thought leadership explicitly tied to the pains and outcomes of ICP accounts.
Impact: More efficient spend, higher conversion rates, and a stronger bridge between demand generation and sales.
Sales
Anchoring territories, routing, and playbooks in the ICP makes sales execution more efficient. Examples of improved GTM efficiency include:
- Territory Mapping: Align territories with ICP concentration to ensure reps work on the highest-yield accounts, rather than just the broadest geographies.
- Routing Rules: Ensure inbound ICP-fit accounts get priority treatment, fast-tracked to the right AE.
- Segment Playbooks: Provide reps with discovery guides, objection handling, and ROI stories tailored to each ICP.
- Qualification Standards: Calibrate BANT/MEDDPICC qualification criteria to ICP definitions, so reps spend less time on poor-fit deals.
Impact: Faster cycles, higher win rates, and a cleaner pipeline that reflects reality.
Business Objectives
Every ICP framework must align directly with business goals. Different ICPs optimize different growth levers:
- Revenue: Focus energy on ICP segments with the highest ASPs to drive top-line growth.
- Volume: Double down on high-win-rate ICPs to maximize sales efficiency.
- Velocity: Prioritize fast-cycle ICPs to close gaps quickly and maintain predictability.
Impact: A direct connection between ICP segments and corporate KPIs.
Chapter 6: Advanced ICP Optimization
Defining ICPs is the starting point. The real advantage comes when companies continuously refine and operationalize them as living assets. The best-performing organizations don't wait years to revisit ICPs—they evolve them dynamically, keeping GTM teams aligned to reality instead of outdated slides.
- Dynamic ICP Management: Best-in-class companies revisit ICPs quarterly. Why? Because markets shift, competitors reposition, and customer needs evolve. A static ICP becomes stale. Dynamic ICPs, however, remain in lockstep with both pipeline goals and market dynamics.
- Intent Intelligence: Adding first- and third-party intent signals (via platforms like 6sense, Demandbase, or Intentsify) transforms ICPs from fit-only to fit + timing. This ensures GTM teams not only know who to target but also when to strike.
- Cohort + Predictive Modeling: By analyzing ICP cohorts longitudinally, companies can forecast future performance—revealing which segments expand and compound value, and which stall out. Predictive models turn today's data into tomorrow's growth playbooks.
- Micro-Segmentation: Golden segments are rarely uniform. Drilling deeper often uncovers micro-segments with outsized performance—those "pockets of gold" that can accelerate revenue disproportionally when identified early.
- Competitive + Market Dynamics: Win/loss analysis at the segment level reveals where you hold a true competitive advantage—and where you're most vulnerable. Pairing this with economic and maturity curve insights allows you to anticipate shifts before they show up in the missed pipeline.
- Technology + Automation: The final layer is embedding ICPs directly into workflows and systems.
o. CRM scoring and routing that prioritize ICP fit.
o. Dynamic website personalization that adjusts messaging by ICP segment.
o. Real-time dashboards that track MMF, PMF, and opportunity signals by segment.
o. Automated alerts when ICP performance deviates.
Why It Matters: ICP optimization isn't a one-time exercise—it's an ongoing discipline. Companies that embrace dynamic ICPs create a self-correcting GTM engine that adapts with the market and compounds its effectiveness over time.
Chapter 7: Building Organizational Alignment
The hardest part of ICPs isn't the data or the math—it's the alignment. ICPs can't live as a marketing project or a sales strategy. To unlock their true potential, they must become the organizational blueprint for how the entire GTM team operates.
- Cross-Functional Collaboration: Establish an ICP Center of Excellence—a working group across marketing, sales, CS, ops, and finance—that co-owns ICP definition, validation, and evolution. This ensures ICPs don't belong to one function; they belong to the company.
- Executive Sponsorship: CRO and CMO should co-lead ICP initiatives, with metrics visible at the board level. When leadership alignment is visible, functional alignment follows.
- Communication + Training: Build a shared language around ICPs. Educate GTM teams regularly on the "who" and the "why" of your ICP segments so they can execute with confidence. Remove silos by eliminating competing definitions of "ideal."
- Accountability: Tie compensation, KPIs, and quarterly reviews to ICP outcomes. If sales, marketing, and CS leaders share responsibility for ICP performance, alignment moves from theory to practice.
- Living Strategy: Treat ICPs as a living framework. Review them quarterly. Refine based on data. Ensure they evolve in tandem with your market.
The Alignment Payoff: When a company embeds its ICP as a shared source of truth, it becomes the connective tissue that unites all GTM functions. Marketing knows where to invest, sales knows where to hunt, and customer success knows where to expand. Leadership can forecast with confidence, transforming ICPs from theory into the operating system for growth.
Conclusion: Shifting to Data-Based ICPs for Strategic GTM Planning & Execution
At AlignICP, we believe ICPs are no longer static personas or marketing slides—they are the system of truth for go-to-market alignment. When built on data, continuously optimized, and embedded into workflows, ICPs unify sales, marketing, and CS around a common purpose: finding, winning, and growing the right customers.